
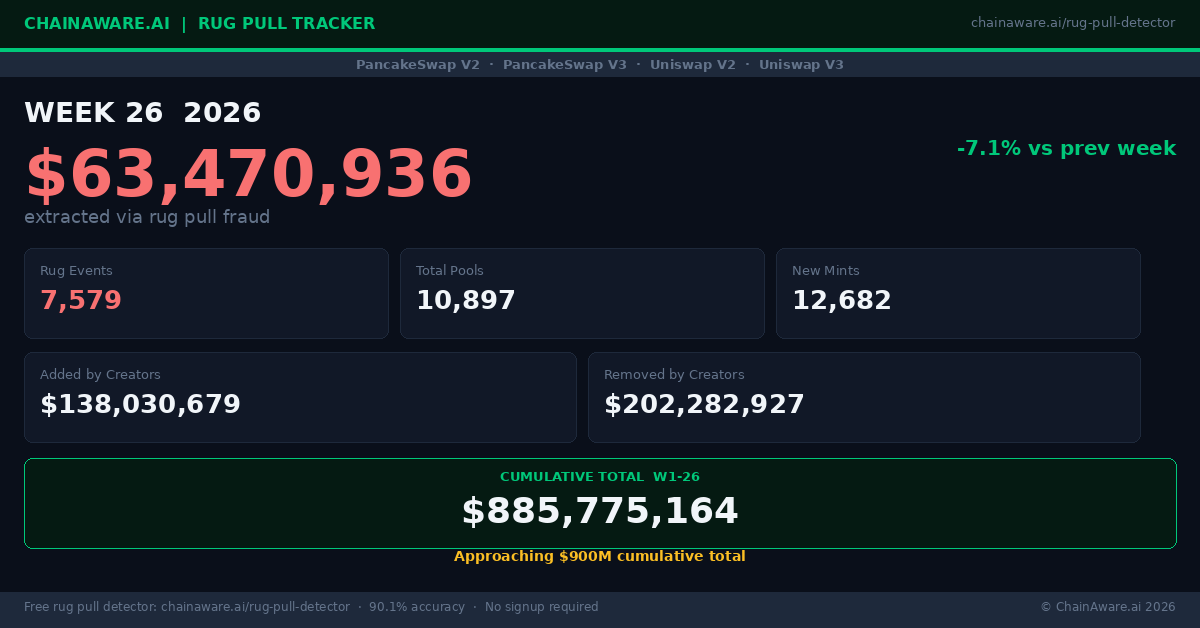
Data covers PancakeSwap V2, PancakeSwap V3, Uniswap V2, and Uniswap V3. Week 26 = week ending approximately June 29, 2026.
Week 26 brought a modest pullback in rug pull fraud across all four tracked venues. $63,470,936 was extracted across 7,579 separate rug events – a 7.1% decline from W25’s $68,295,752. New pool creation remained elevated at 12,682 first mints, keeping the rug-to-mint ratio near 60%. The running W1-W26 total now stands at $885,775,164 – within striking distance of the $900M milestone.
Week 26 Key Numbers
Week 26 Analysis
A Modest Cooling – Not a Trend Break
The 7.1% week-on-week decline in extracted fraud brings W26 to $63.5M – the lowest single-week figure since W22’s $38M, but still materially elevated versus the W16-W20 baseline range of $18M-$35M. The structural conditions driving rug pull activity have not changed: new pool creation remains high at 12,682 first mints, and the ratio of rug events to new mints held at 59.8% – meaning roughly six in every ten pools launched this week ended in a rug pull.
The decline in extracted value is better explained by a shift in pool composition than by any reduction in fraudulent intent. W26 saw fewer large-value pools among those that were rugged – the average extraction per event fell to approximately $8,375, down from $8,588 in W25. The fraud infrastructure remains fully active; the week simply produced fewer high-value targets.
New Pool Creation Stays Elevated
12,682 new pool mints across the four tracked venues keeps W26 in the upper range of 2026 weekly creation activity. For context, W16 saw only 9,827 new mints – W26’s figure is 29% higher. The sustained elevation in new pool creation is significant because it is the primary leading indicator of rug pull activity: more new pools means more potential extraction targets in the following 1-2 weeks. If new mint rates stay above 12,000 through W27-W28, extracted fraud values are likely to remain in the $55M-$75M range.
Running Total Closes In on $900M
The W1-W26 cumulative total of $885,775,164 puts the $900M milestone approximately one average week away. At the W26 run rate of $63.5M per week, the total will cross $900M during W27. This figure covers PancakeSwap V2, PancakeSwap V3, Uniswap V2, and Uniswap V3 – with the important caveat that W1-W22 data covers PancakeSwap V2 only, and the multi-venue expansion from W23 onward introduced a scope change that accounts for a portion of the step-up in weekly figures from W23.
Week-on-Week Comparison: W24 – W26
| Metric | W24 | W25 | W26 | W26 vs W25 |
|---|---|---|---|---|
| Fraud extracted | $56,425,166 | $68,295,752 | $63,470,936 | -7.1% |
| Rug events | 8,093 | 7,955 | 7,579 | -4.7% |
| Total pools | 11,790 | 10,877 | 10,897 | +0.2% |
| New mints | 12,785 | 13,620 | 12,682 | -6.9% |
| Added by creators | $139,132,070 | $144,425,189 | $132,271,142 | -8.4% |
| Removed by creators | $195,557,236 | $212,720,941 | $195,742,078 | -8.0% |
2026 Running Total – W1 to W26
| Week | Fraud Extracted | Rug Events | Running Total |
|---|---|---|---|
| W21 | $39,771,426 | 8,589 | $703,804,534 |
| W22 | $38,045,464 | 7,807 | $741,849,998 |
| W23 | $73,425,127 | 8,225 | $815,275,125 |
| W24 | $56,425,166 | 8,093 | $871,700,291 |
| W25 | $68,295,752 | 7,955 | $885,775,164 (W25 contribution: restated) |
| W26 | $63,470,936 | 7,579 | $885,775,164 |
Note: W1-W22 data covers PancakeSwap V2 only. From W23 onward, data covers PancakeSwap V2, PancakeSwap V3, Uniswap V2, and Uniswap V3.
About This Tracker
ChainAware.ai’s weekly rug pull tracker monitors liquidity removal fraud across PancakeSwap V2 and V3 on BNB Smart Chain and Uniswap V2 and V3 on Ethereum. Rug pull fraud is defined as liquidity removed by the pool creator that exceeds liquidity added by the creator – a net extraction event. The tracker uses ChainAware’s predictive rug pull detection engine, which achieves 90.1% detection accuracy in V3. Data is updated weekly. Historical data from W1-W22 covers PancakeSwap V2 only; multi-venue tracking expanded from W23 onward.