
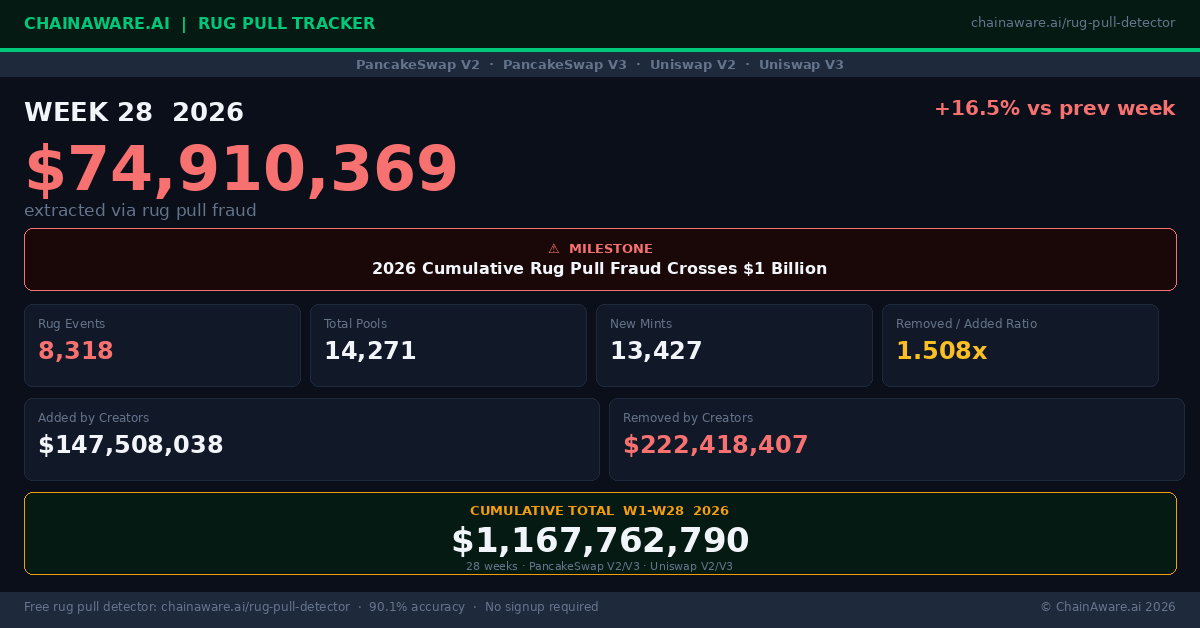
Data covers PancakeSwap V2, PancakeSwap V3, Uniswap V2, and Uniswap V3. Week 28 = week ending approximately July 13, 2026.
Week 28 delivered the sharpest single-week acceleration since W23. $74,910,369 was extracted across 8,318 separate rug events – a 16.5% surge from W27’s $64,301,289 and the highest weekly fraud total since W23’s $73,425,127. The W1-W28 cumulative total now stands at $1,167,762,790 – the 2026 running total has crossed $1 billion. That figure covers PancakeSwap V2, PancakeSwap V3, Uniswap V2, and Uniswap V3, and represents a confirmed floor: it excludes honeypot contracts, LP token transfer rugs, and associated wallet extraction.
Week 28 Key Numbers
Week 28 Analysis
Sharpest Acceleration Since W23
The 16.5% week-on-week increase in extracted fraud brings W28 to $74.9M – the highest single-week figure in five weeks and a decisive break from the $63M-$64M range that characterised W26 and W27. Both extraction value and event count moved in the same direction: rug events rose from 8,144 to 8,318 (+2.1%), while average extraction per event climbed from $7,896 to $9,007 – a 14.1% jump. This combination of more events and higher per-event value is characteristic of the surge cycles visible throughout the 2026 dataset, most notably in the W23 spike and the W43-W45 2025 peaks.
The removed-to-added liquidity ratio ticked up to 1.508x in W28 – creators removed $1.51 for every $1.00 they seeded. This ratio had been compressing slightly through W26-W27 (1.480x and 1.466x respectively). The W28 expansion signals that larger operators with higher extraction efficiency re-entered the market this week alongside the sustained baseline of smaller-scale activity.
Rug Events at Highest Level Since W23
8,318 rug pull events is the highest weekly event count since W23’s 8,225. Event count has now climbed for three consecutive weeks: 7,579 (W26) → 8,144 (W27) → 8,318 (W28). This sustained upward trend in event frequency, combined with the W28 jump in per-event extraction value, produces the largest weekly fraud total since the W23 anomaly.
New pool creation at 13,427 mints is marginally lower than W27’s 13,901 but remains well above the W16-W17 low of approximately 9,800-13,000 mints per week. The rug-to-mint ratio of 61.9% means that for every 10 new pools launched in W28, more than 6 ended in a liquidity extraction event. That ratio has been above 55% for every week since W21.
$1 Billion in Context
The 2026 cumulative total of $1,167,762,790 – based on the restated full-year dataset – places the scale of tracked rug pull fraud in sharper relief. Several context points are worth stating explicitly.
First, this figure covers four venues only: PancakeSwap V2 and V3 on BNB Smart Chain, and Uniswap V2 and V3 on Ethereum. It does not include rug pull activity on Raydium, Jupiter, or other Solana DEXes; on Base, Arbitrum, or other L2s; or on any other EVM chain. The actual 2026 total across the full DeFi ecosystem is almost certainly a multiple of the tracked figure.
Second, the definition used is conservative: only direct liquidity removal events where the creator removes more than they added are counted. Honeypot contracts, LP token transfer rugs, and associated wallet extraction are excluded. The $1.17B figure is a methodologically conservative floor.
Third, the pace is accelerating. The first $500M was tracked across W1-W15 (15 weeks). The second $500M was tracked across W16-W26 (11 weeks). W27 and W28 together added another $139M. The weekly run rate has increased materially since the scope expanded to four venues from W23 onward.
Week-on-Week Comparison: W26 – W28
| Metric | W26 | W27 | W28 | W28 vs W27 |
|---|---|---|---|---|
| Fraud extracted | $63,470,936 | $64,301,289 | $74,910,369 | +16.5% |
| Rug events | 7,579 | 8,144 | 8,318 | +2.1% |
| Total pools | 13,196 | 14,400 | 14,271 | -0.9% |
| New mints | 12,682 | 13,901 | 13,427 | -3.4% |
| Added by creators | $132,271,142 | $138,081,060 | $147,508,038 | +6.8% |
| Removed by creators | $195,742,078 | $202,382,348 | $222,418,407 | +9.9% |
| Removed-to-added ratio | 1.480x | 1.466x | 1.508x | +2.9% |
2026 Running Total – W23 to W28
| Week | Fraud Extracted | Rug Events | Running Total |
|---|---|---|---|
| W23 | $73,425,127 | 8,225 | $840,359,143 |
| W24 | $56,425,290 | 8,094 | $896,784,433 |
| W25 | $68,295,763 | 7,956 | $965,080,196 |
| W26 | $63,470,936 | 7,579 | $1,028,551,132 |
| W27 | $64,301,289 | 8,144 | $1,092,852,421 |
| W28 | $74,910,369 | 8,318 | $1,167,762,790 |
Note: W1-W22 data covers PancakeSwap V2 only. From W23 onward, data covers PancakeSwap V2, PancakeSwap V3, Uniswap V2, and Uniswap V3. Running totals restated from full 2026 dataset.
About This Tracker
ChainAware.ai’s weekly rug pull tracker monitors liquidity removal fraud across PancakeSwap V2 and V3 on BNB Smart Chain and Uniswap V2 and V3 on Ethereum. Rug pull fraud is defined as liquidity removed by the pool creator that exceeds liquidity added by the creator – a net extraction event. The tracker uses ChainAware’s predictive rug pull detection engine, which achieves 90.1% detection accuracy in V3. Data is updated weekly. Historical data from W1-W22 covers PancakeSwap V2 only; multi-venue tracking expanded from W23 onward.